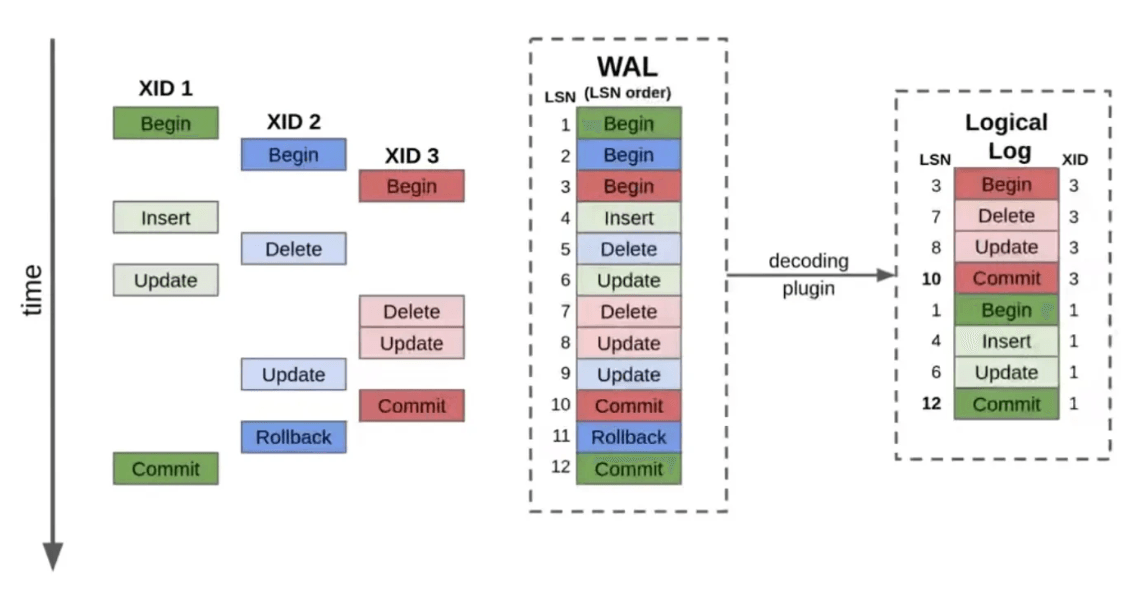
Write-ahead logging (WAL) is essential to PostgreSQL's crash recovery and Change Data Capture (CDC) replication. Tracking the amount of WAL generated over time can help developers understand the volume of changes happening in their database, which is particularly useful for evaluating replication systems or monitoring replication performance.
In this article, we’ll walk through how to measure WAL throughput using SQL queries in PostgreSQL. We will create a table and views that allow you to track and calculate WAL volume over specific periods.
Step 1: Set Up a Table to Track WAL LSN Positions
To start, you’ll need a table to store the Log Sequence Numbers (LSNs) along with timestamps. This allows you to record the current LSN over time, which we can later use to calculate the WAL volume.
plaintextCREATE TABLE wal_lsn_history (
    id SERIAL PRIMARY KEY,
    timestamp TIMESTAMPTZ DEFAULT CURRENT_TIMESTAMP,
    lsn_position pg_lsn
);
This table captures two key pieces of information:
timestamp: The exact time the LSN was recorded.lsn_position: The current LSN when the row is inserted.
The Log Sequence Number (LSN) in PostgreSQL is a unique identifier for a specific location within the WAL. An LSN might look like this: 0/16B3740. This represents a specific point in the WAL, which the system can use to determine where to read or write next.
Step 2: Create a Function to Record the Current WAL LSN
Next, you will create a function that inserts the current LSN into the wal_lsn_history table. This function can be called periodically to track changes in the WAL.
plaintextCREATE OR REPLACE FUNCTION record_current_wal_lsn()
RETURNS void AS $$
BEGIN
    INSERT INTO wal_lsn_history (lsn_position)
    VALUES (pg_current_wal_lsn());
END;
$$ LANGUAGE plpgsql;
You can execute this function manually or set up a cron job to run it at regular intervals, depending on how often you want to sample the WAL LSN.
Step 3: Create a View for WAL Volume Analytics
This view calculates the WAL bytes generated between each recorded LSN and the time difference between samples. It allows you to analyze WAL throughput over time.
plaintextCREATE OR REPLACE VIEW wal_volume_analytics AS
WITH time_periods AS (
    SELECT
        timestamp,
        lsn_position,
        LEAD(timestamp) OVER (ORDER BY timestamp DESC) as prev_timestamp,
        LEAD(lsn_position) OVER (ORDER BY timestamp DESC) as prev_lsn
    FROM wal_lsn_history
),
calculations AS (
    SELECT
        timestamp,
        lsn_position,
        EXTRACT(EPOCH FROM (timestamp - prev_timestamp)) as seconds_diff,
        pg_wal_lsn_diff(lsn_position, prev_lsn) as bytes_written
    FROM time_periods
    WHERE prev_lsn IS NOT NULL
)
SELECT
    timestamp,
    lsn_position,
    bytes_written as wal_bytes_since_previous,
    pg_size_pretty(bytes_written) as wal_size_since_previous,
    ROUND(bytes_written::numeric / NULLIF(seconds_diff, 0), 2) as bytes_per_second,
    pg_size_pretty((bytes_written::numeric / NULLIF(seconds_diff, 0))::bigint) || '/s' as rate_pretty,
    seconds_diff as seconds_since_previous
FROM calculations
WHERE seconds_diff > 0
ORDER BY timestamp DESC;
Explanation of Columns in the View:
wal_bytes_since_previous: The number of bytes written to the WAL since the previous LSN.wal_size_since_previous: Human-readable size of the WAL written (e.g., KB, MB).bytes_per_second: The rate of WAL generation, in bytes per second.rate_pretty: A human-readable version of the rate, in KB/s or MB/s.seconds_since_previous: The time difference between the current and previous LSN sample.
Example Output
The following output shows the calculated WAL volume for each recorded LSN:
timestamp | wal_size_since_previous | bytes_per_second | rate_pretty | seconds_since_previous |
| 2024-10-01 14:22:10 +00:00 | 2 MB | 250000.00 | 244 KB/s | 8 |
| 2024-10-01 14:22:02 +00:00 | 1.5 MB | 187500.00 | 183 KB/s | 8 |
Step 4: Create Summary Views for Time Windows
To provide a broader overview of WAL volume over various time windows (e.g., last 5 minutes, last hour), we can create another view that summarizes the WAL volume over configurable periods.
plaintextCREATE OR REPLACE VIEW wal_volume_summary AS
WITH time_windows AS (
    SELECT
        'Last 5 minutes' as window,
        5 as minutes,
        NOW() - INTERVAL '5 minutes' as start_time
    UNION ALL
    SELECT 'Last 15 minutes', 15, NOW() - INTERVAL '15 minutes'
    UNION ALL
    SELECT 'Last hour', 60, NOW() - INTERVAL '1 hour'
    UNION ALL
    SELECT 'Last day', 1440, NOW() - INTERVAL '1 day'
),
wal_diffs AS (
    SELECT
        h.timestamp,
        h.lsn_position,
        LAG(h.lsn_position) OVER (ORDER BY h.timestamp) as prev_lsn
    FROM wal_lsn_history h
),
calculated_wal AS (
    SELECT
        wd.timestamp,
        wd.lsn_position,
        wd.prev_lsn,
        pg_wal_lsn_diff(wd.lsn_position, wd.prev_lsn) as wal_diff
    FROM wal_diffs wd
    WHERE wd.prev_lsn IS NOT NULL
)
SELECT
    w.window,
    COUNT(*) as samples,
    pg_size_pretty(SUM(c.wal_diff)) as total_wal_size,
    pg_size_pretty(AVG(c.wal_diff)::bigint) as avg_wal_per_minute,
    pg_size_pretty((SUM(c.wal_diff)::numeric / (w.minutes * 60))::bigint) || '/s' as avg_rate
FROM
    time_windows w
    JOIN calculated_wal c ON c.timestamp > w.start_time
GROUP BY w.window, w.minutes
ORDER BY w.minutes;
Quick Explanation of Columns:
window: The measured time window.samples: Number of WAL size samples.total_wal_size: Total WAL size written in the time window.avg_wal_per_minute: Average WAL generated per minute.avg_rate: Average rate of WAL generation (e.g., KB/s).
Example Output
window | samples | total_wal_size | avg_wal_per_minute | avg_rate |
| Last 5 minutes | 3 | 10 MB | 2 MB | 341 KB/s |
| Last 15 minutes | 34 | 30 MB | 2 MB | 227 KB/s |
| Last hour | 532 | 120 MB | 2 MB | 341 KB/s |
| Last day | 3243 | 2 GB | 1.5 MB | 170 KB/s |
And there we have it! Detailed statistics of WAL throughput over time. Keep in mind the WAL contains other stuff as well, so this is still just an approximation of change event throughput, but it is as close as we can get. Here's why:
- WAL Logging: WAL logs more than just data changes—it also includes metadata and internal information not always reflected in CDC output.
- WAL Compression: PostgreSQL can compress operations or include additional overhead (e.g., transaction IDs) that CDC might exclude.
- Row-Level vs Full Writes: Some CDC tools might capture only the new values, while WAL logs old and new data along with metadata, affecting size comparisons.
But of course we don’t want to manually run the size collection function every time, so as a last step, let’s take a look at how we can automate this.
Scheduling WAL Data Collection with Cron
To continuously monitor WAL throughput over time, you need to collect the WAL LSN positions at regular intervals. This can be easily achieved by using cron jobs, a Linux-based task scheduler that runs scripts or commands at specified intervals.
If you prefer to avoid external tools like cron, PostgreSQL offers an internal job scheduling option using the pg_cron extension. pg_cron allows you to run SQL-based jobs directly within the database without needing to manage external scripts. This is particularly useful if you want to keep everything self-contained within PostgreSQL.
Step 1: Install pg_cron
First, you need to install and enable pg_cron. On most PostgreSQL installations, you can do this by running:
Install pg_cron via your package manager (e.g., for Ubuntu/Debian):
plaintextsudo apt install postgresql-16-cron- Load the extension into your PostgreSQL instance:
plaintextCREATE EXTENSION pg_cron;- Ensure
pg_cronis set up to run jobs by editing yourpostgresql.conffile to include the cron schema:
plaintextshared_preload_libraries = 'pg_cron'- Then, restart your PostgreSQL instance to apply the changes.
Step 2: Schedule WAL Data Collection
With pg_cron installed and loaded, you can now schedule jobs directly in SQL. To collect WAL LSN data periodically, use the following command to schedule the record_current_wal_lsn() function to run every minute:
plaintextSELECT cron.schedule('Record WAL LSN every minute', '*/1 * * * *', 'SELECT record_current_wal_lsn();');This command schedules the record_current_wal_lsn() function to run every minute using the cron syntax. The job will be handled entirely within PostgreSQL, eliminating the need for external scripts or cron setups.
Step 3: Monitor Scheduled Jobs
You can monitor and manage your scheduled jobs within PostgreSQL using pg_cron. To see the list of jobs scheduled with pg_cron, you can query the cron.job table:
plaintextSELECT jobid, schedule, command, nodename, nodeport, active FROM cron.job;If you want to stop a scheduled job, you can disable it using the cron.unschedule function:
plaintextSELECT cron.unschedule(jobid);Step 4: Adjusting the Collection Frequency
As with standard cron, you can adjust the frequency by modifying the cron syntax in the schedule string:
*/5 * * * *: Every 5 minutes.0 * * * *: Every hour.0 0 * * *: Every day at midnight.
Conclusion
Measuring WAL throughput is an important part of monitoring and optimizing PostgreSQL, especially for systems that rely on replication. By using the table, functions, and views outlined in this article, you can track how much data is being written to the WAL in real-time and over specific periods. This can help you make informed decisions about replication system evaluations, performance tuning, and database scaling.

About the author
Dani is a data professional with a rich background in data engineering and real-time data platforms. At Estuary, Daniel focuses on promoting cutting-edge streaming solutions, helping to bridge the gap between technical innovation and developer adoption. With deep expertise in cloud-native and streaming technologies, Dani has successfully supported startups and enterprises in building robust data solutions.
Popular Articles


