Graphing GitHub CI build times with remote transformations and Flow
Create a real-time pipeline with a Cloudflare Workers transformation to monitor build times from the GitHub API.

TL;DR: A new Flow tutorial/demo is available on GitHub. It demonstrates two main things:
- How to use Flow to visually monitor data from the GitHub API, specifically, CI build times.
- How to create a Flow derivation with a remote transformation using Cloudflare Workers.
Why monitor GitHub Actions CI builds?
If you’ve worked on a software project of substantial size, you’re probably familiar with GitHub Actions. For the uninitiated, GitHub Actions is a continuous integration/continuous delivery (CI/CD) platform built into GitHub. It allows development teams to automate workflows: series of jobs that test, build, and/or deploy code based on certain events.
For example, you might have a CI workflow that builds and tests every new commit to a repository. In fact, that’s what the development team has here at Estuary.
Ideally, we don’t want workflow runs to take more than a few minutes. But in reality, slow CI is a common problem. Left unchecked, long CI builds can bog down development teams.
That’s why it’s important to keep an eye on CI build times so we can work to improve them over time. We need to answer questions like:
- How have the average CI build times changed over time?
- What else is going on on days when the average build time is higher?
The GitHub API gives us access to lots of data that can help us find answers. We can capture that data with Flow — see the docs for a list of the possible GitHub API data collections.
In the new tutorial, we learn how to answer the first question, how build times change over time. To do so, we:
- Capture data on workflow runs from GitHub.
- Transform the data into the shape of a useful table.
- Materialize the table to Google Sheets (spreadsheets are dead; long live spreadsheets).
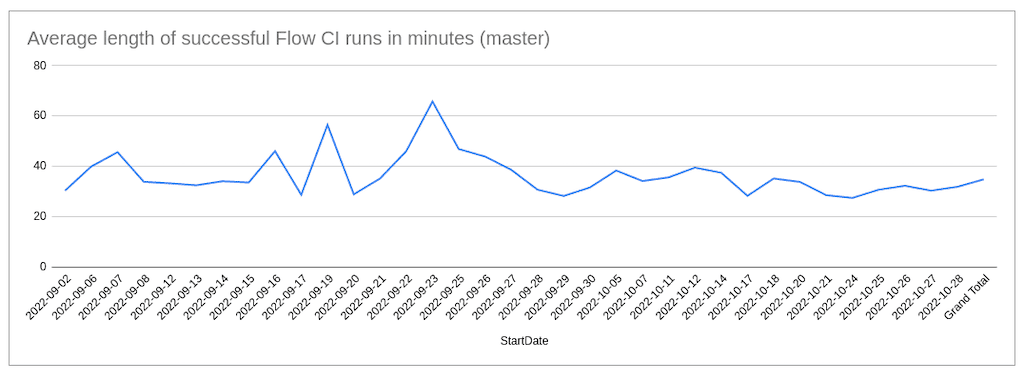
- Use a pivot table and a line graph to visualize the average CI build time by day over time.
Remote transformations and Cloudflare Workers
Flow derivations offer native data transformations. We recently discussed on the blog why TypeScript is the first language we support natively. We also have a user guide on how to implement these Flow-native TypeScript transformations.
But! Even before we roll out support for more types of transformations, you are by no means limited to Flow’s native transforms. We certainly recommend them, but we understand that there are use cases where they might not be ideal for you. This is why Flow also supports remote transformations.
You can host your function anywhere, as long as it’s accessible over HTTP(S). This type of transformation involves a bit more technical know-how than the native way, and the workflow looks different depending on where you choose to host the transformation. This is our first tutorial that shows you how to do this with a specific platform!
The tutorial uses Cloudflare Workers: a serverless execution environment with a useful free plan.
(Yes, the transformation function in the tutorial is still in TypeScript. That’s because TypeScript and JavaScript happen to be Cloudflare’s recommended languages, and Flow automatically generated boilerplate TypeScript. Cloudflare also supports others, though. In your own work, you’re welcome to use other languages.)
Monitor the things you care about
This workflow is endlessly customizable. I know you are probably thinking: “yes, obviously,” but I want to bring it up anyway.
Don’t use GitHub actions? Track contributions over time. Or re-shape a dataset from any of the other sources Flow supports. Make dozens of graphs in Google Sheets or steer clear of Google Sheets entirely. It doesn’t matter – the data is yours.
Grab your Flow trial and check out the demo and tutorial here.

Author
Popular Articles


